Read Review

Introduction to Observability
In today's technological forefront, the complex digitalized systems behind every business demand robust observability tools. If one or more key processes within your entity are digitalized at any point, it means that you are already oriented towards digital maturity and beginning to adopt a data-driven approach. The question is: Does the organization have the mechanisms and tools necessary to know precisely how these business processes are performing?
In this article, we will see how observability, being a broad and multifaceted concept, can lead to various specialized practices and tools to cover a wide range of use cases. Today, it stands as fundamental to ensuring operational continuity and fostering continuous improvement of modern digital businesses. Its goal is to obtain a deep understanding of the internal state of systems through the data they generate.
Every department within the business is essential for its proper functioning: Sales and Marketing, Production and Operations, Finance, Supply Chain Management, Customer Service, Information Technology (IT), etc. Even if you don't have all of them or are missing some, you can surely get much more out of them. Do you really know how they perform? What is their performance? Where are the most common bottlenecks? What economic impact are they having? What incidents are they experiencing? How can you anticipate them?
Observability, as a discipline within the IT field, helps you answer all these questions.
Fundamentals of Observability
Definition and Concept
In general terms, it can be defined as the ability to deduce the internal state of a system solely from its external outputs. In the realm of software, this translates to the ability to discern the functioning and behavior of a monolithic or distributed system through the information it reveals. This implies that if the outputs are known over a sufficient period and we understand how the system responds to inputs, it is possible to infer or reconstruct all possible internal states of the system.
Its Impact on Business
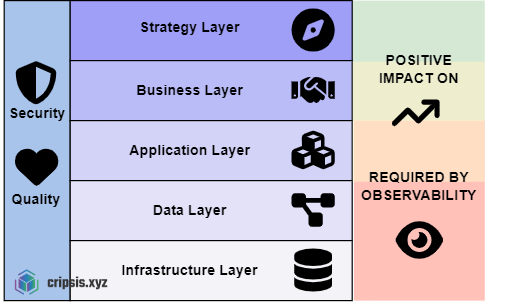
Observability is not just a technical tool; it is a strategic facilitator that profoundly impacts various aspects of the business and is therefore key in a digital transformation process. Observability begins at the infrastructure layer of the organization's resources, starting to extract data (metrics, logs) from these hardware resources, up to the application layer from which traces will also be extracted.
Below are the main benefits and how they translate into tangible competitive advantages:
Improvement in Operational Continuity
Observability allows identifying and solving problems before they become critical incidents. By having clear and real-time visibility of systems, companies can minimize downtime and ensure operational continuity. This is crucial to maintaining customer trust and avoiding significant economic losses.
Performance Optimization
With observability tools, it is possible to continuously monitor and analyze the performance of applications and processes. This facilitates the detection of bottlenecks and inefficient areas, allowing adjustments and improvements that optimize resource usage and enhance operational efficiency.
Cost Reduction
The ability to quickly identify problems and optimize resources contributes to a significant reduction in operating costs. Fewer interruptions and better allocation of technological and human resources result in savings that can be reinvested in other business areas.
Increase in Customer Satisfaction
A highly observable system can ensure better performance and service availability, which translates to a more positive customer experience. The ability to quickly resolve problems and maintain smooth operations increases customer satisfaction and loyalty.
Improved Decision-Making
Observability provides valuable and actionable data that inform strategic decisions. Business leaders can base their decisions on accurate information about system performance and state, improving the planning and execution of strategies.
Promotion of Innovation
With a clear view of the internal functioning of systems, development and operations teams can experiment and test new ideas with greater confidence. The rapid identification and resolution of problems allow for a more agile development cycle and continuous innovation.
Compliance and Security
Observability also plays a critical role in regulatory compliance and security. It allows detailed monitoring of activities and accesses within the system, helping to quickly detect and respond to potential security threats and ensure regulatory compliance.
Evolution from Traditional Monitoring
Observability is often heard as a significant evolution from traditional monitoring in several key aspects, and it is the case. Tools like Nagios, Icinga, Pandora FMS, etc., have been key in modern history and the foundation and proper diagnosis of incidents in the IT world. This does not mean that observability directly replaces traditional monitoring; instead, it complements and is part of it. It could even be said that it is the first phase within its implementation.
Here are the details of how observability builds and expands on the foundation of traditional monitoring:
Breadth and Depth of Data
Traditional Monitoring:
- Focuses mainly on pre-established indicators and system health metrics such as CPU, memory, and response times.
- Collects data based on known thresholds to trigger alerts.
Observability:
- Collects not only metrics but also exhaustive traces and logs that provide a detailed view of all system operations.
- Allows retrospective analysis to understand why certain behaviors occurred, not just when they deviated from the norm.
Interrogability and Diagnostics
Traditional Monitoring:
- Offers a limited and often reactive view, suitable for known and previously defined problems.
- Limited in capacity to explore or investigate issues without prior definitions of what to look for.
Observability:
- Designed to allow operators to ask ad-hoc questions about system behavior, even questions that had not been considered before a problem arose.
- Facilitates a deep understanding of the "how" and "why" behind system states, not just the "what."
Focus on User Experience
Traditional Monitoring:
- Mainly oriented to ensure systems operate within operational parameters.
- Less focus on how specific user interactions affect or are affected by the underlying infrastructure.
Observability:
- Includes a strong focus on the end-user experience, evaluating system performance from the user's perspective through end-to-end monitoring and distributed traces.
- Identifies how system shortcomings affect real user transactions and flows.
Use of Advanced Technology
Traditional Monitoring:
- Relies heavily on static tools with little learning or automatic adaptation.
- Requires frequent manual configuration and adjustments.
Observability:
- Employs advanced techniques such as artificial intelligence and machine learning for predictive analysis and anomaly detection.
- Continuously adapts to changes in the system environment, improving incident detection and response.
Scalability and Dynamism
Traditional Monitoring:
- Often faces difficulties scaling or adapting to large and distributed systems.
- Can be ineffective in dynamic or rapidly evolving environments.
Observability:
- Ideal for microservices environments and distributed architectures, where components can change or scale dynamically.
- Provides tools to synchronize and correlate data across a variety of sources and services.
In summary, observability not only enhances traditional monitoring but also redefines system management by providing more sophisticated tools and techniques suitable for the current complex and ever-changing technological landscape.
The 3 Fundamental Pillars of Observability
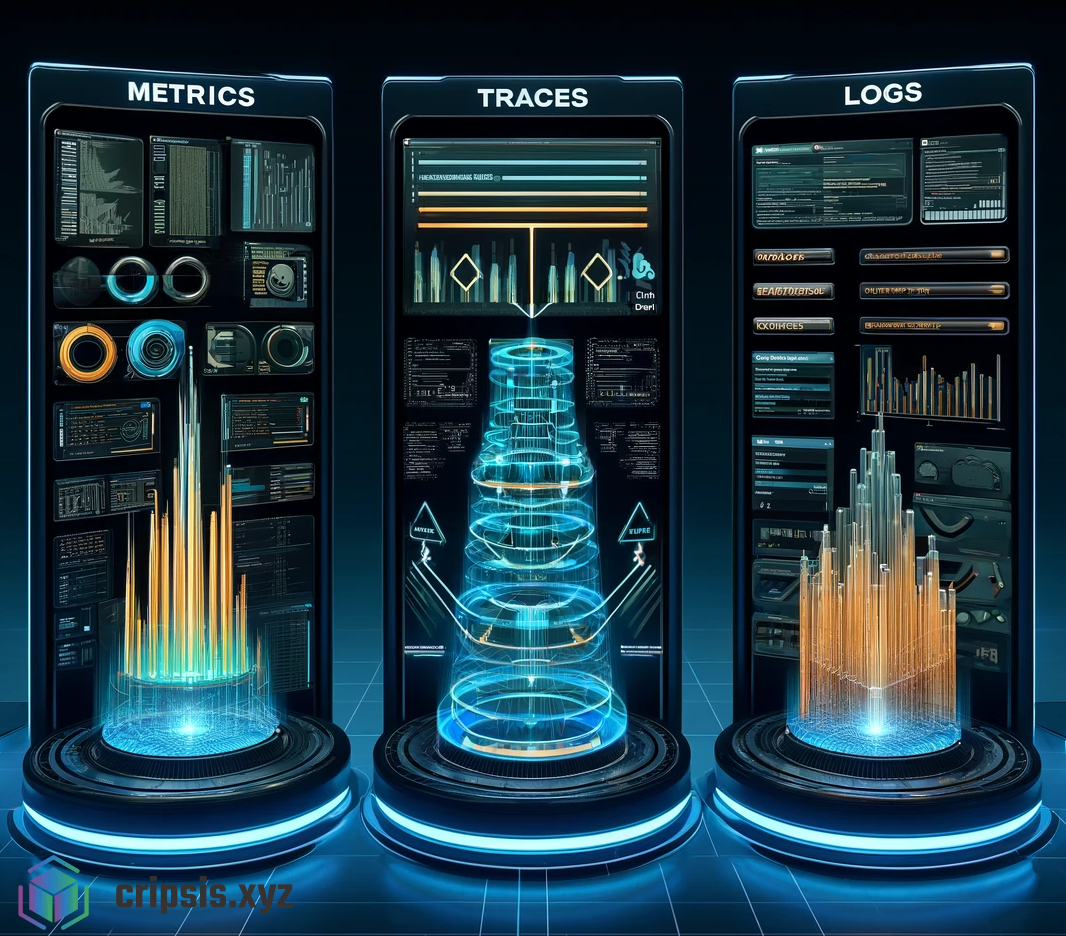
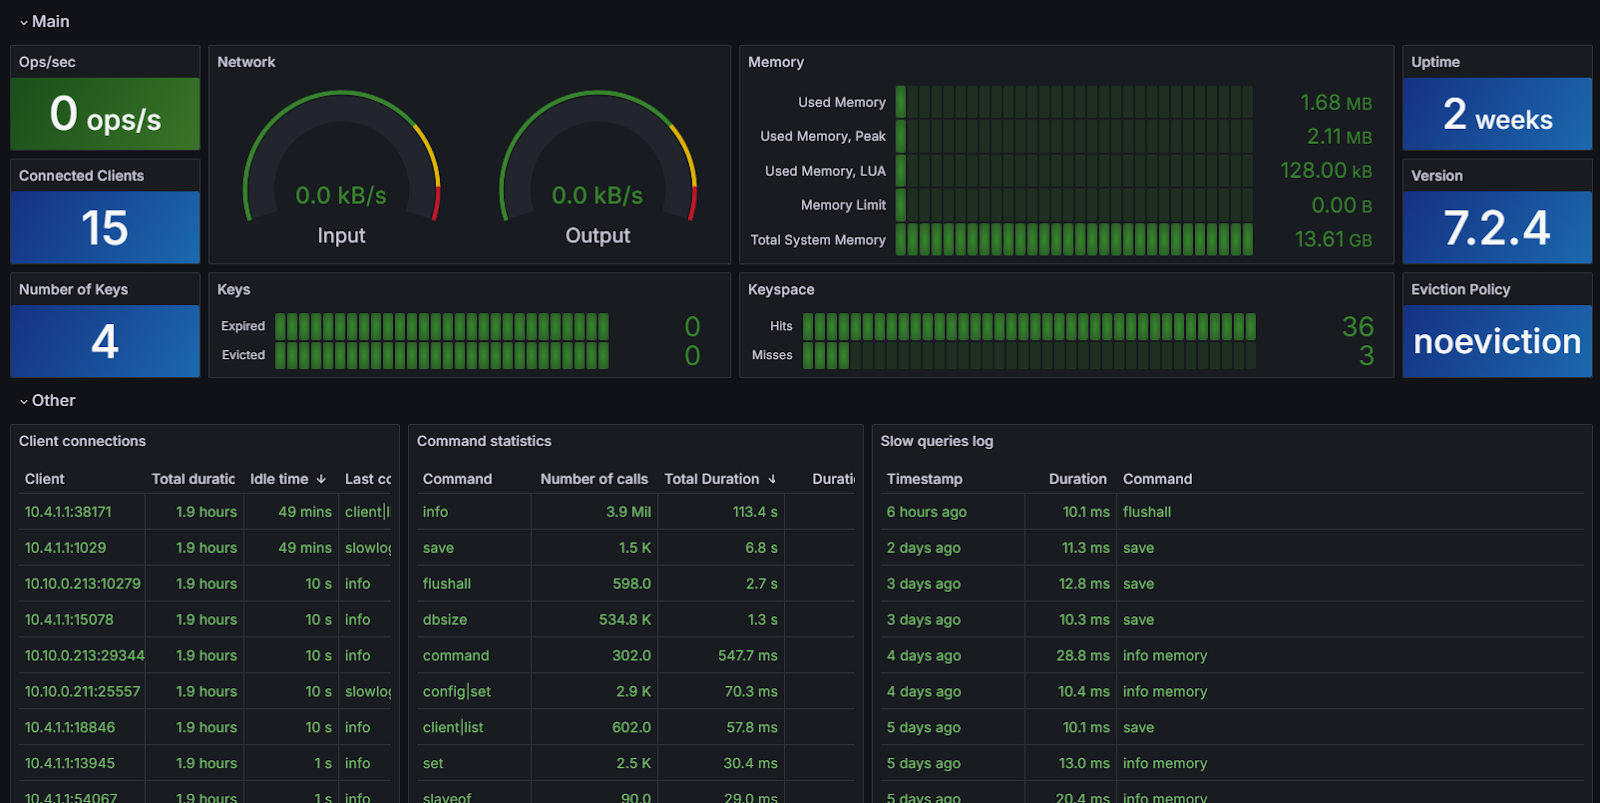
Technically, observability is based on three main pillars: logs, metrics, and traces. Each of these elements provides a unique and complementary view of the system's behavior, facilitating a comprehensive understanding of its state and performance.
Logs
Logs are detailed records of events that occur within a system. They are automatically generated by applications, services, and infrastructure components and are essential for problem diagnosis and post-mortem analysis. Logs can be of various types, such as error logs, access logs, audit logs, among others.
Example:Suppose we have a web application that manages online orders. If a user tries to place an order and the operation fails, the log might contain an entry like this:
2023-06-12 14:22:30 ERROR OrderService - Order ID: 12345 failed due to payment processing error. User ID: 67890This record provides crucial information about the timing and nature of the error, helping developers identify and resolve the issue.
Metrics
Metrics are quantitative data representing the performance and state of different system components. They are collected and stored at regular intervals, allowing operations teams to monitor system health and detect anomalies in real time.
Example:
Continuing with our online order application example, a relevant metric could be the number of orders processed per minute. If normally 100 orders are processed per minute, but suddenly this figure drops to 20, it indicates a possible issue that needs investigation.
{
  "timestamp": "2024-05-20T14:35:00Z",
  "metric": "pedidos_procesados",
  "value": 20
}
Additionally, other metrics such as CPU usage, request latency, and available memory are also crucial for assessing the overall system performance.
Traces
Traces provide a detailed view of the path of a request through various services and components of a distributed architecture. They are essential for understanding transaction flows and identifying bottlenecks or failures in the service chain.
Example:
Imagine a user places an order in our online order application. A trace could show how this request travels from the front-end to the authentication service, then to the order processing service, and finally to the database. If there is a delay in order processing, the trace can reveal that the bottleneck is in the authentication service, which takes longer than expected to verify the user.
TraceID: 5f3c1e2d9a3b
---
Start: 2024-05-20T14:35:22Z
Duration: 3.2s
Steps:
1. Authentication (0.8s)
2. Order Processing (2.0s)
3. Database Update (0.4s)
Correlation between Logs, Metrics, and Traces
The true power of observability lies in the ability to correlate logs, metrics, and traces to gain a holistic view of the system. While logs offer a detailed record of specific events and errors, metrics provide a quantitative view of real-time performance, and traces reveal the path and latency of requests across services. Combining these data allows operations and development teams to connect the dots and understand the full context of issues. For example, a spike in request latency metrics can correlate with a specific error recorded in the logs, and the corresponding trace can identify exactly where in the application's flow the delay occurred. This correlation not only accelerates problem identification and resolution but also facilitates proactive improvements in infrastructure and code.
The Observability Stack
Today, multiple "stacks" or frameworks facilitate the extraction, processing, and ingestion of information in structured data lakes. This allows implementing observability with existing integrations for many technologies and more straightforwardly than manually developing "connectors" for each application. However, once data is obtained, it is often necessary to shape it or cross it with other data, add information, remove it, etc. All of this is achieved with data manipulation tools usually offered by the observability stacks themselves. They are typically a set of tools and technologies that enable monitoring, analyzing, and managing the state of digital systems, providing complete and real-time visibility into the performance, availability, and behavior of applications and infrastructure.
Structure
Currently, modern observability stacks typically include the following elements or functionalities:
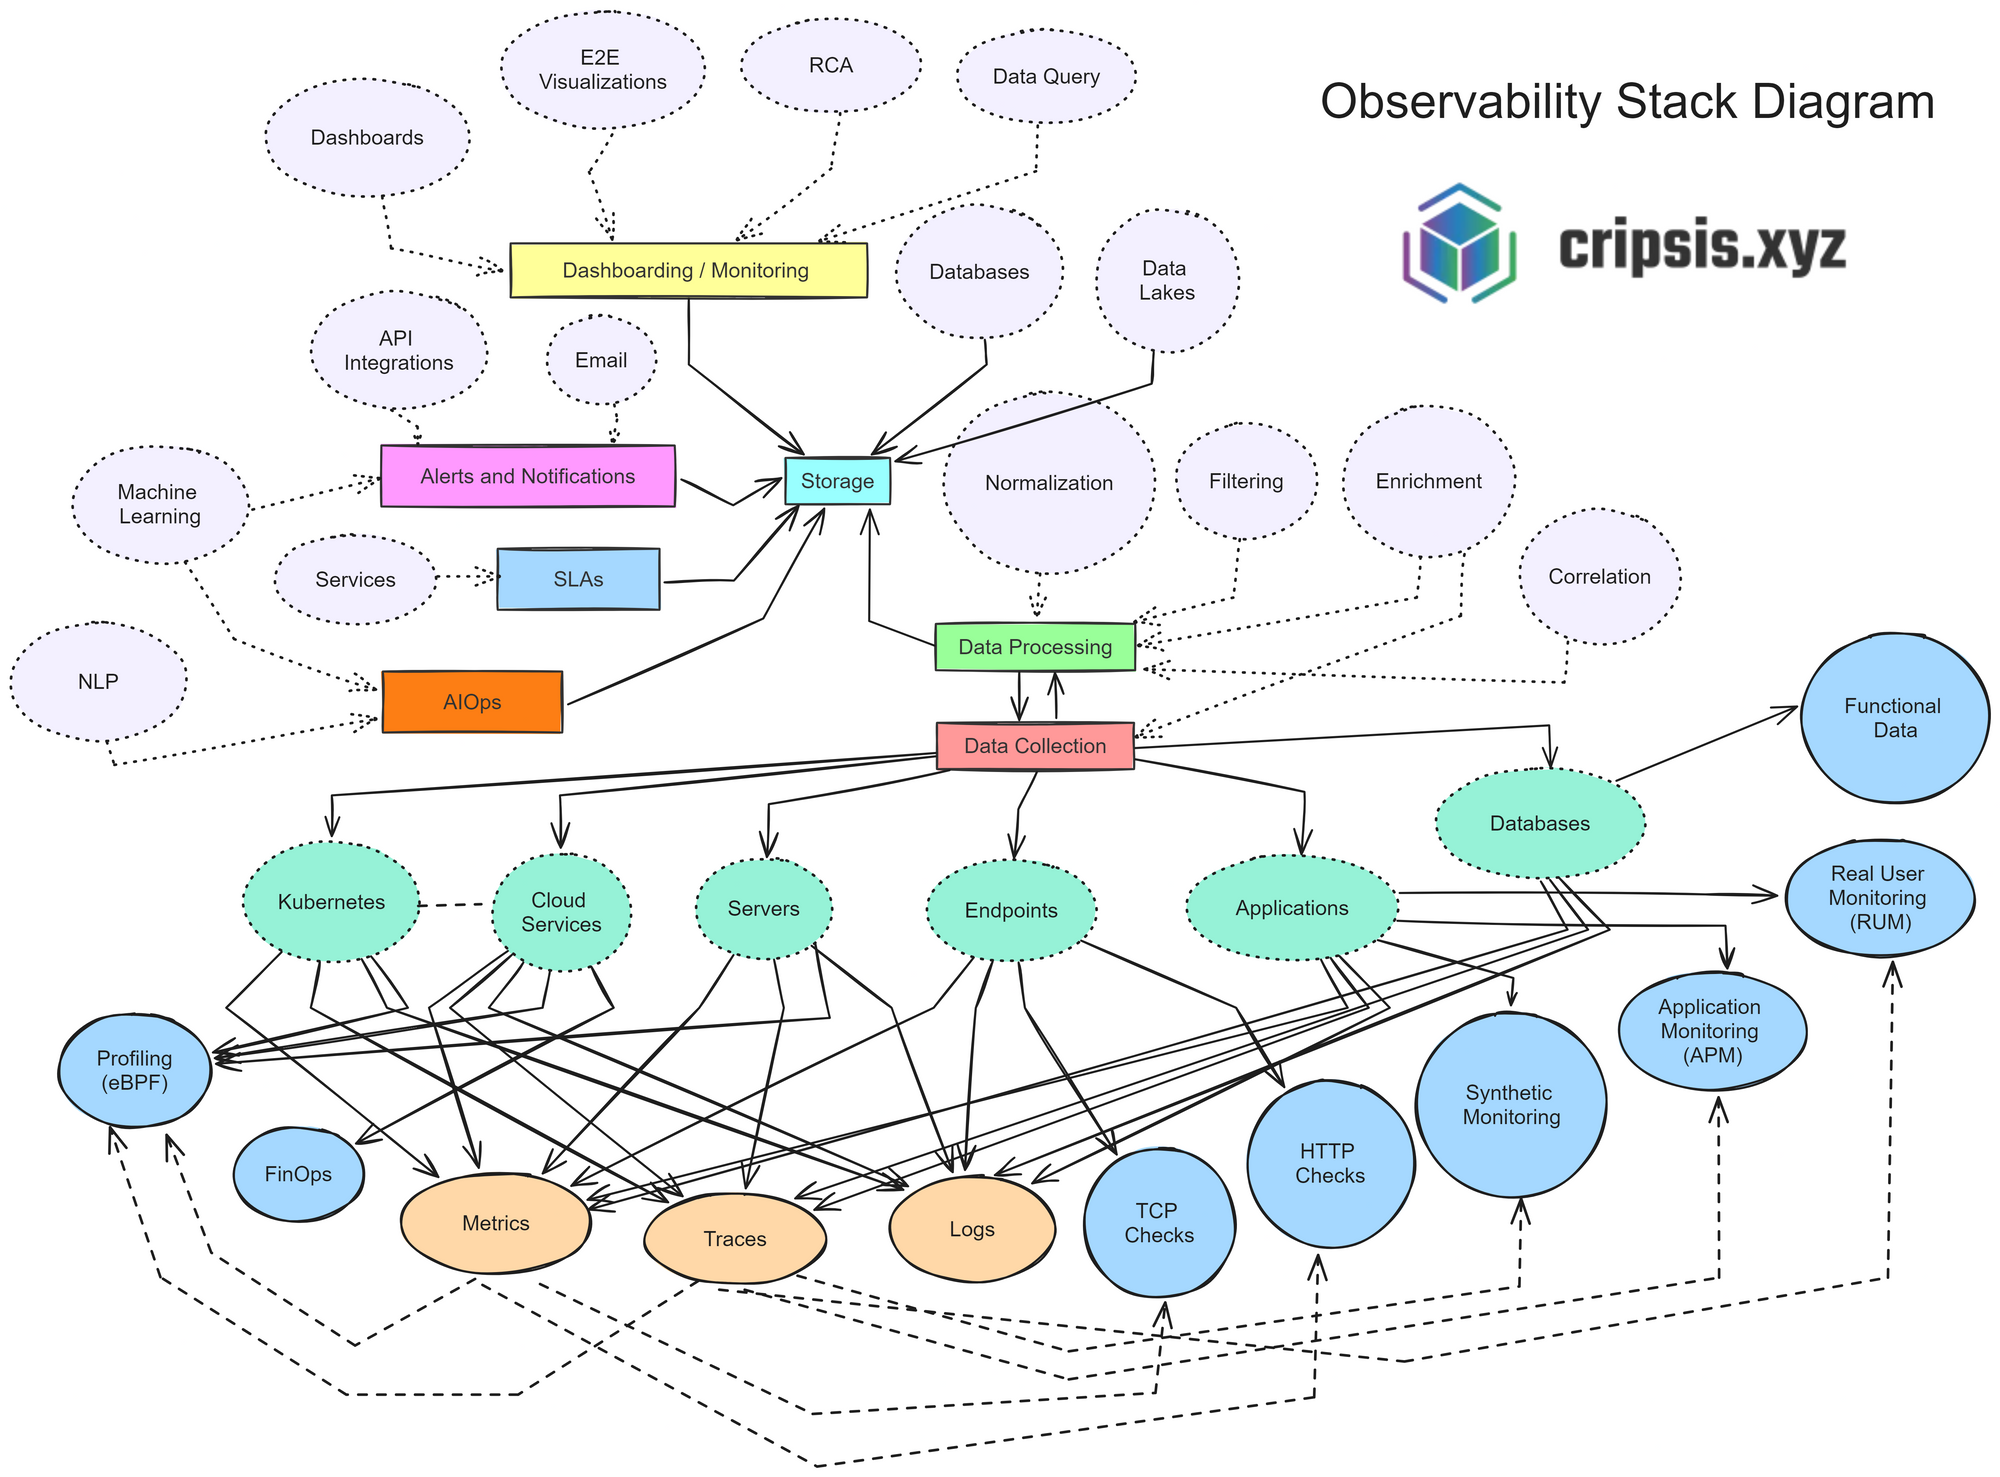
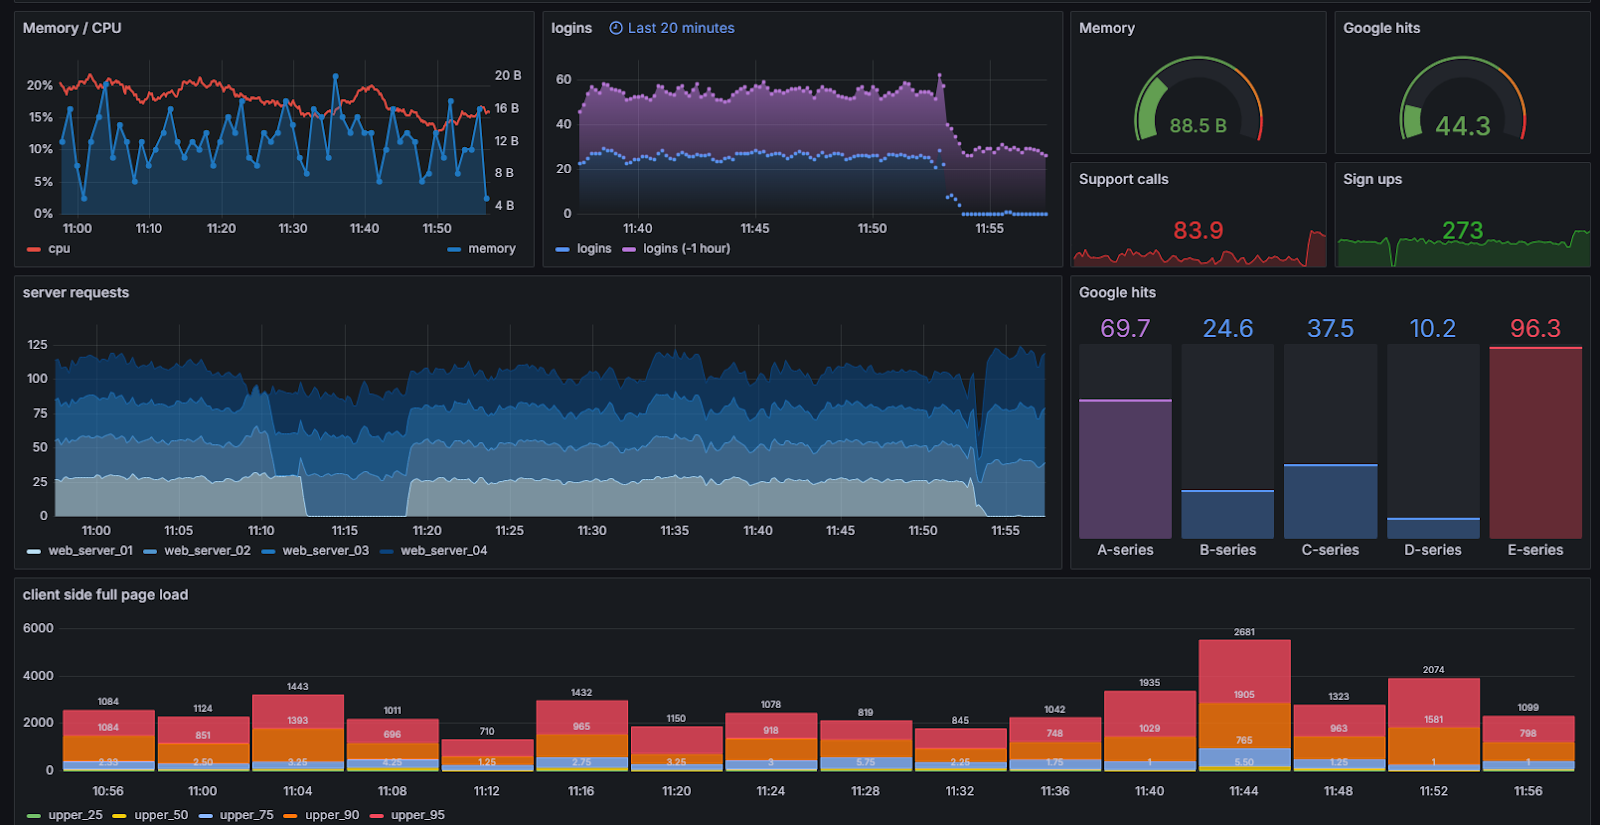
Dashboarding and Monitoring
Observability allows the ability to visualize and monitor data effectively. Dashboards provide a visual interface where data can be presented in graphs and tables, facilitating quick interpretation of information. End-to-end (E2E) visualizations help understand the complete data flow through the system, while root cause analysis (RCA) is crucial for identifying the underlying cause of problems. Traditional data query tools and databases, along with data lakes for unstructured storage, complement this section, offering quick and flexible access to information.
Alerts and Notifications
The ability to receive real-time alerts and notifications is vital for a quick and effective response to incidents. These notifications are achieved through API integrations that enable instant communication between systems, as well as email notifications that ensure relevant teams are always informed.
SLAs
Service level agreements (SLAs) play a crucial role in this process, establishing metrics and thresholds that ensure alerts are both relevant and actionable. These metrics and thresholds are designed to minimize noise and avoid false alarms, allowing IT teams to focus on the most critical and urgent incidents.
Data Collection and Processing
The foundation of observability lies in the efficient collection and processing of data. This involves several stages: secure and scalable storage of collected data, normalization to standardize formats and facilitate analysis, filtering to eliminate noise and focus on the most relevant data, and enrichment that adds useful context to raw data. Event and data correlation is essential for uncovering hidden patterns and relationships, facilitating a deeper understanding of issues. This correlation capability allows organizations not only to detect problems quickly but also to understand their root causes, thereby improving the effectiveness of responses and implemented solutions.
AIOps
Artificial intelligence for IT operations (AIOps) represents the next frontier in technology operations management. Applying advanced algorithms and machine learning techniques, AIOps enhances operations by continuously analyzing data and automating responses. This enables proactive and predictive management, significantly reducing downtime and improving operational efficiency.
The use of Machine Learning (ML) for anomaly detection helps identify problems before they affect the end-user. Supervised and unsupervised machine learning algorithms can learn normal behavioral patterns in systems and detect deviations that could indicate imminent failures or vulnerabilities. These algorithms can analyze large volumes of data in real-time, identifying anomalous behaviors such as unusual traffic spikes, frequent application errors, or system performance degradation. Anomaly detection based on machine learning not only alerts IT teams to potential problems but can also automatically trigger corrective actions, such as workload rebalancing or security patching.
Natural language processing (NLP) can analyze logs and alerts, classifying them and providing additional context, enabling more effective data search and faster problem resolution. NLP is especially useful for handling large volumes of unstructured data, such as those generated by monitoring systems and event logs. Through semantic analysis and contextual understanding, NLP can transform this data into actionable information. For example, it can identify and correlate similar events, group related alerts, and suggest solutions based on previous incidents.
Additionally, NLP facilitates interaction between AIOps systems and human operators through conversational interfaces or chatbots, which can answer questions, provide status reports, and execute specific actions based on natural language commands. This not only improves the accessibility and usability of monitoring and management tools but also allows IT teams to resolve issues more quickly and efficiently.
Overall, machine learning and natural language processing in the context of AIOps enable advanced observability, where systems are not only passively monitored but are capable of learning, adapting, and autonomously responding to changing conditions and emerging challenges. Anomaly detection plays a crucial role in this process, providing an additional layer of security and resilience. This leads to a more resilient IT infrastructure, with enhanced capacity to maintain business continuity and deliver optimized user experiences.
Sources and Types of Data
In a digitized environment, data comes from various sources, such as on-premise servers and cloud services. The types of data collected include quantitative metrics on performance and state, transaction and request traces, and event logs and system messages. Checks such as TCP checks and HTTP checks ensure connectivity and availability. Additionally, synthetic monitoring simulates user transactions, and real user monitoring analyzes the actual user experience, providing critical information for continuous improvement.
Analysis and Optimization
The functional data derived from observability is essential for performing detailed system performance analysis (profiling) and financial optimization of cloud resources (FinOps). These analyses allow organizations to optimize their operations, reducing costs and improving efficiency. Profiling helps identify bottlenecks and opportunities for performance improvement, while FinOps focuses on maximizing the value of investment in cloud infrastructure, balancing cost and performance.
Conclusion
Observability has become a cornerstone for managing digital systems in the context of digital transformation. Its ability to provide comprehensive and real-time visibility into the state and performance of systems not only improves operational continuity and efficiency but also facilitates more informed and strategic decision-making. By integrating logs, metrics, and traces, and leveraging advanced technologies such as machine learning and natural language processing, observability offers a holistic perspective that allows identifying, diagnosing, and resolving issues proactively.
The evolution from traditional monitoring to observability has significantly expanded organizations' capabilities to manage complex and distributed infrastructures, improving not only resilience and security but also the end-user experience. Modern observability stacks, with their advanced dashboarding, alerting, data collection and processing tools, and AIOps, represent a crucial advancement in technology operations management, ensuring that organizations can adapt and thrive in a dynamic and competitive digital environment.
Ultimately, the implementation of observability practices allows companies not only to react to incidents but also to anticipate them, optimizing resources, reducing costs, and fostering a culture of continuous improvement and innovation. Observability is not just a technical tool; it is an essential strategic enabler for any organization seeking to maintain its relevance and competitiveness in today's market.